
GOES-16 “Red” Visible (0.64 µm) and “Clean” Infrared Window (10.35 µm) images (with and without an overlay of GLM Flash Extent Density) [click to play animation | MP4]
1-minute
Mesoscale Domain Sector GOES-16
(GOES-East) “Red” Visible (
0.64 µm) and “Clean” Infrared Window (
10.35 µm) images — with and without an overlay of
GLM Flash Extent Density
(above) — showed the development of a large Mesoscale Convective System (MCS) that developed over North Dakota and moved eastward into Minnesota on
17 July 2020.

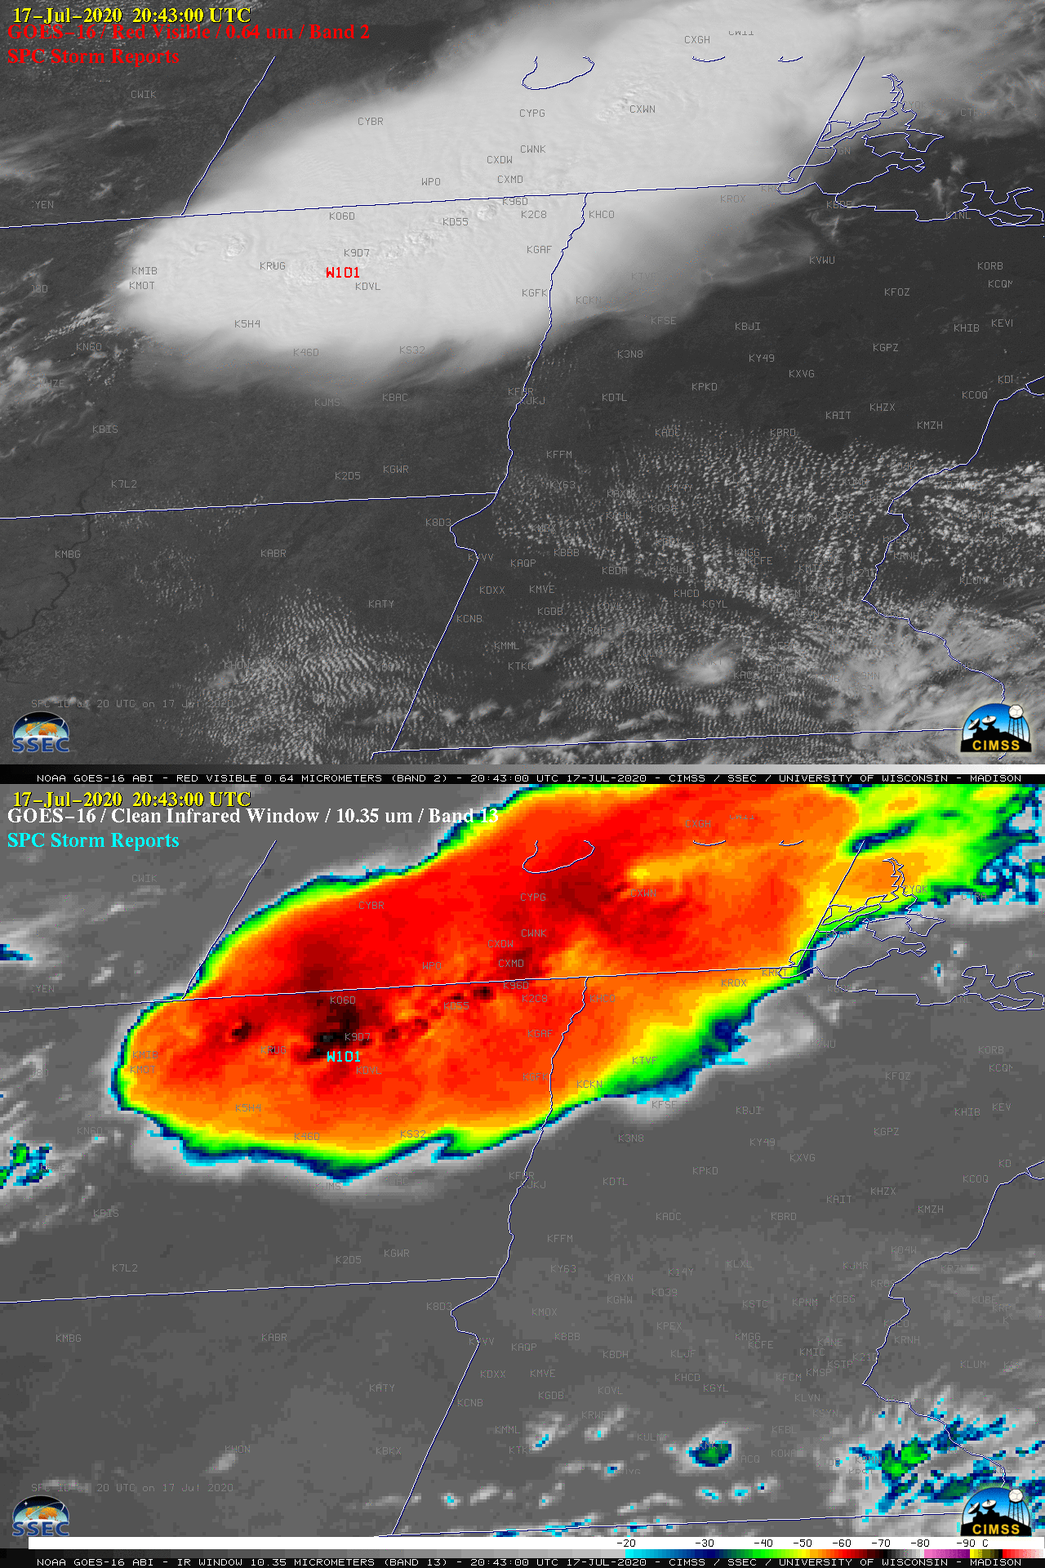
GOES-16 “Red” Visible (0.64 µm) images, with time-matched SPC Storm Reports plotted in red [click to play animation | MP4]
1-minute GOES-16 Visible images
(above) and Infrared images
(below) include time-matched plots of
SPC Storm Reports — of particular note was the wind gust of
101 mph that occurred at a
RAWS site in the vicinity of a brief tornado in North Dakota.

GOES-16 “Clean” Infrared Window (10.35 µm) images, with time-matched SPC Storm Reports plotted in cyan [click to play animation | MP4]
These severe thunderstorms with tall cloud tops provided a good demonstration of the
parallax shift inherent in GOES imagery at higher latitudes. Time-matched comparisons of Infrared images from NOAA-20
at 1933 UTC and Suomi NPP
at 2023 UTC with the corresponding images from GOES-16
(below) showed that the GOES images were shifted northwest of the more accurate NOAA-20/Suomi NPP images. The superior 375-meter spatial resolution of the
VIIRS instrument allowed subtle cloud-top gravity waves to be seen — and the VIIRS cloud-top infrared brightness temperatures were about 10ºC colder than those sensed by the
ABI instrument. The 1933 UTC images were about 15 minutes prior to the tornado and 101-mph wind gust at Churches Ferry (located about 20 miles northwest of Devils Lake KDVL).

Infrared Window images from NOAA-20 (11.45 µm) and GOES-16 (10.35 µm) at 1933 UTC [click to enlarge]

Infrared Window images from Suomi NPP (11.45 µm) and GOES-16 (10.35 µm) at 2023 UTC [click to enlarge]
An image showing parallax correction vectors and distance for a 50,00 ft (15.2 km) cloud top feature at various points within the GOES-16 CONUS domain
(below) is from
this site — and indicates a southeastward correction of about 28-30 km (or 17-19 miles) over northeastern North Dakota. This is in good agreement with what is seen in the 2 infrared image comparisons shown above.

Parallax correction vectors (green) and distance (in km, red) for a 50,00 ft (15.2 km) cloud top feature at various points within the GOES-16 CONUS domain [click to enlarge]
from CIMSS Satellite Blog
https://cimss.ssec.wisc.edu/satellite-blog/archives/37668




No comments:
Post a Comment